
I-24 MOTION
Since 2018, I have helped conceptualize, develop, construct, and operate the I-24 MOTION testbed. The system is intended to serve as the most densely instrumented open-road testbed and data collection instrument for highway traffic, as well as an experimentation facility for connected and automated vehicles and technology. Construction of the testbed completed in 2022 with a total of 294 cameras providing non-stop visual coverage of four miles of Interstate 24, southeast of Nashville, TN. I now serve as the engineering and technology lead for I-24 MOTION.
The best place to read more about I-24 MOTION is on its website.
The field hardware making the system possible includes 4K-resolution IP cameras, a custom camera mount and enclosure allowing this unprecedented density of coverage, over 100 network components to transmit petabytes worth of video data, and a 40Gb fiber network connected to Vanderbilt University. On the data processing front, we built a dedicated server cluster to ingest video feeds, process them into vehicle trajectories using 3D computer vision with coordinate system calibration, and host all the necessary data for the system.
This project has, and continues to, rely on an entire team to make it a reality and a success. From the hardware in the field to the software on the server cluster, all aspects must be operational and resilient to produce the rich data that the system is uniquely capable of generating.
Decision support system for I-24 Smart Corridor
The I-24 Smart Corridor is a large-scale integrated corridor management project seeking to improve the travel experience between Nashville and Murfreesboro, TN. The system is based on a variety of intelligent transportation systems technologies and relies on an extensive software backend to manage the roadway. I lead the software development for the artificial intelligence decision support system (AI-DSS), which suggests response plans to corridor managers so they can respond quickly to changing traffic conditions.
The AI-DSS monitors a network of around 50 radar traffic detectors and a feed of reported incidents in the area. It uses this information, along with addition data sources, to generate recommendations for the 67 lane control and variable speed limit sign clusters that inform the motoring public and control traffic. It will also be able to recommend diversion routing plans during roadway incidents, which can consist of modified signal timing plans for surface streets to reduce delay.
Optimization for railroad dispatching
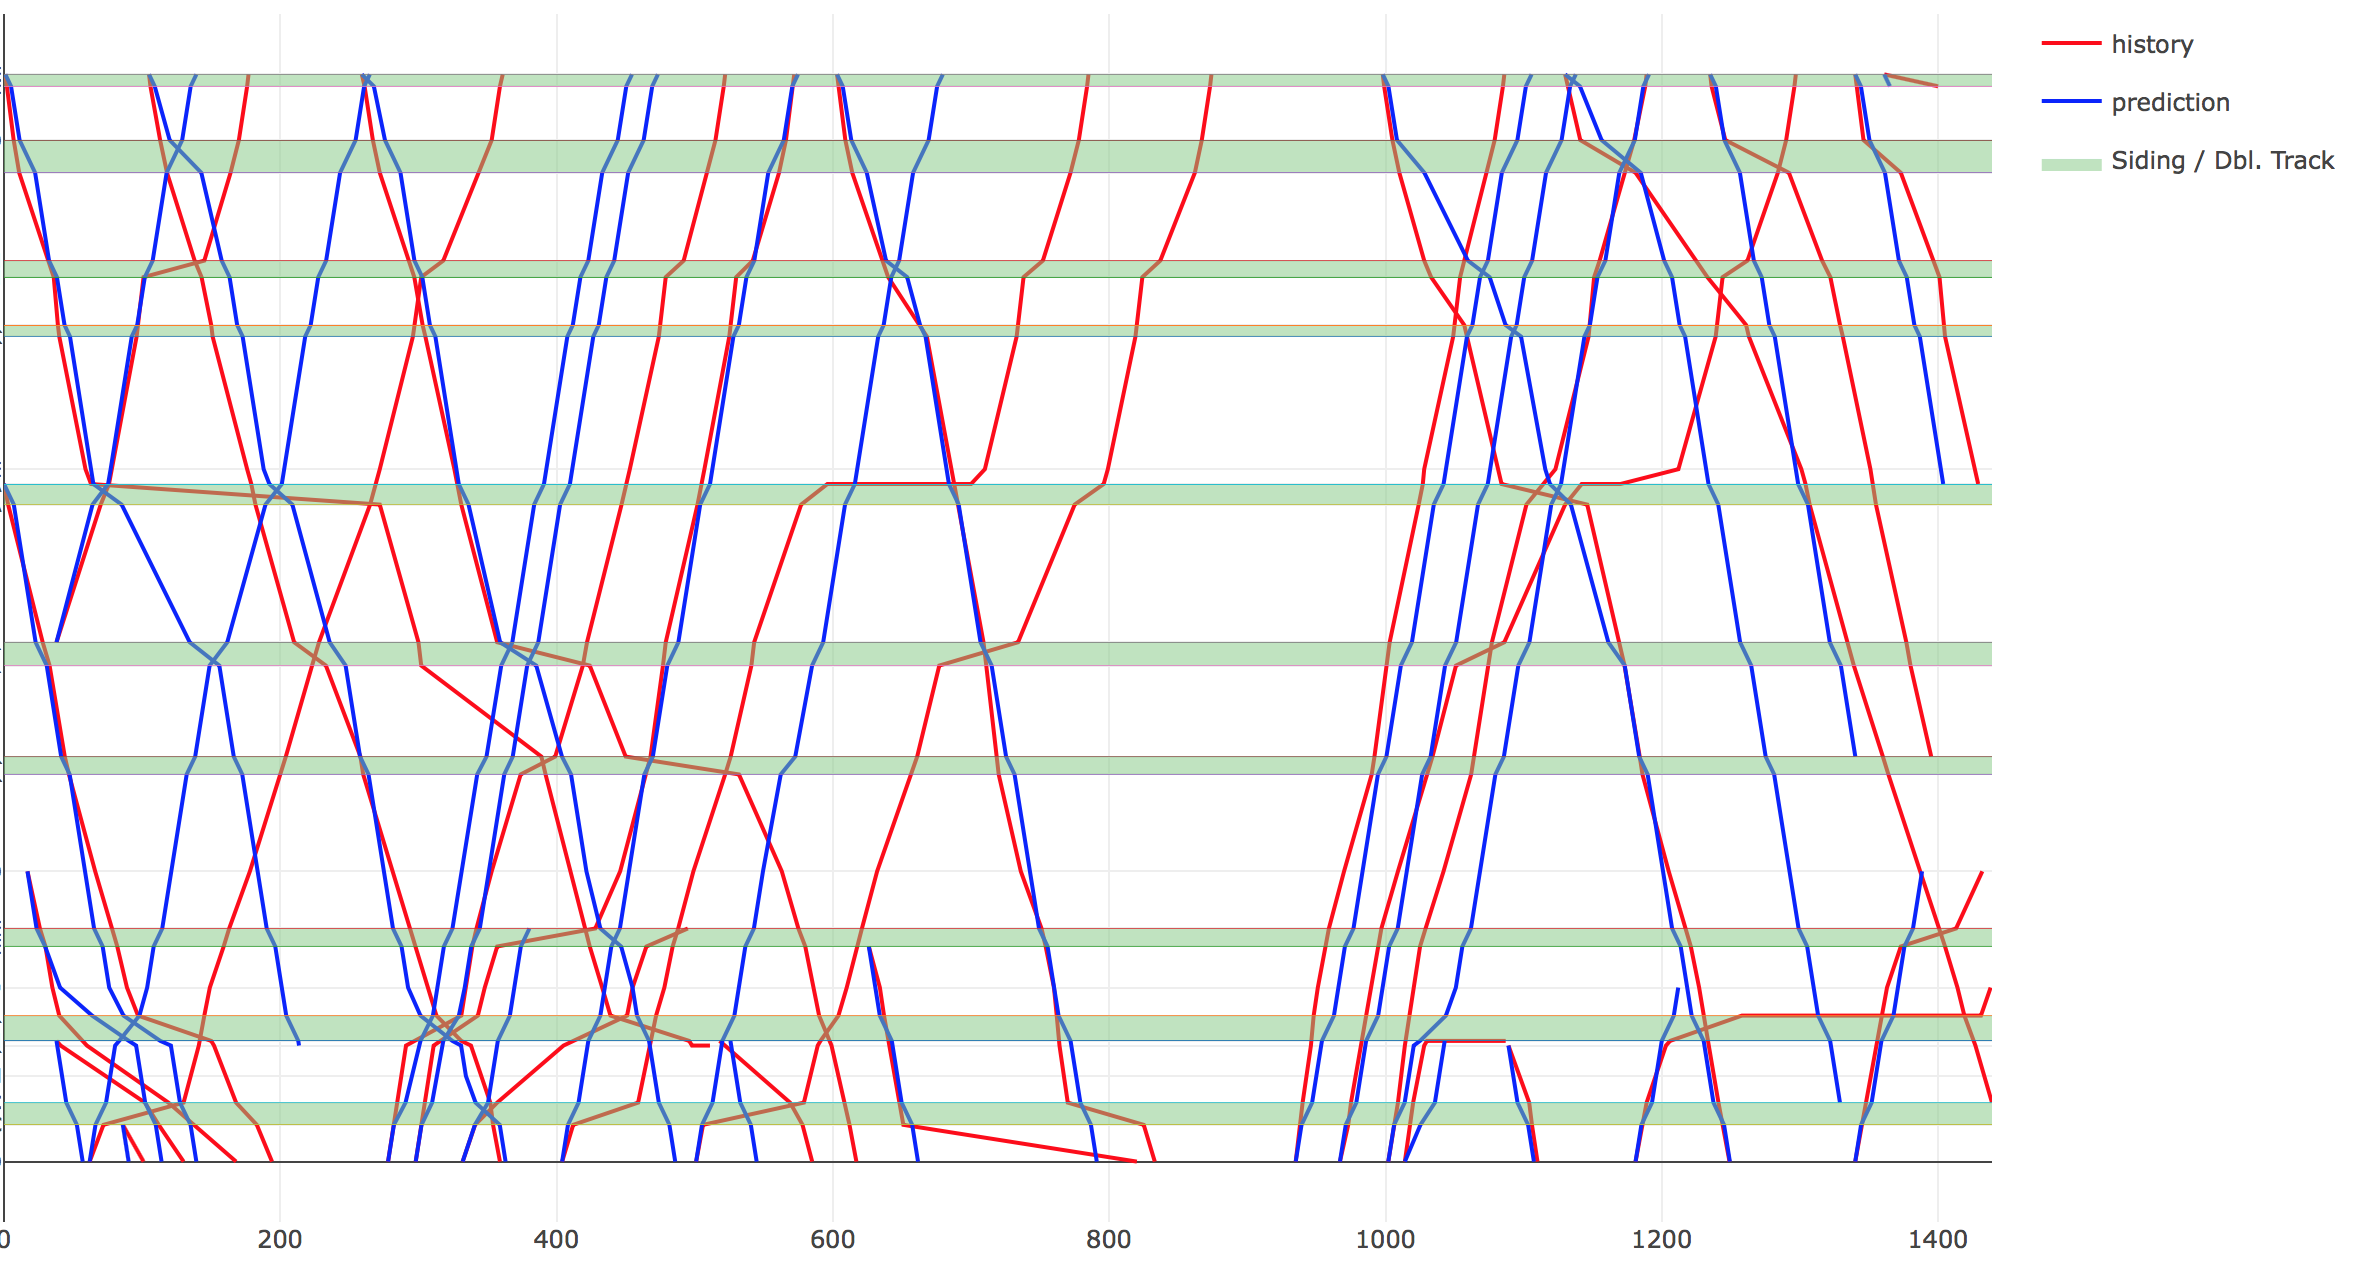
I have written a mixed integer linear optimization model that dispatches trains according to signaling constraints on single track railway lines with passing sidings and does so optimally according to the minimization of a weighted delay measure.
This concept is similar to that used in commercial computer-aided dispatching systems, but those systems have the notable shortcoming of being overridden often in areas with complex dispatching situations. That is, they do not match the behavior of human dispatchers well. I propose to remedy this problem by performing inverse optimization according to known historical data for single track rail lines.
Specifically, the forward optimization problem (dispatching trains) can be tuned to match historical dispatching behavior as closely as possible. The resulting dispatching model is a useful simulation tool that could be used for prediction of train arrivals, assessment of dispatching performance, investigation of track infrastructure layout, and schedule optimization.
Tools:
- Python 3 (with parallel processing)
- AMPL mathematical programming language
- CPLEX optimization solver
- Blackbox optimization packages
- Plotly enhanced visualization
- FFMPEG multimedia processing library
- PostgreSQL database
Management of shared e-scooter parking
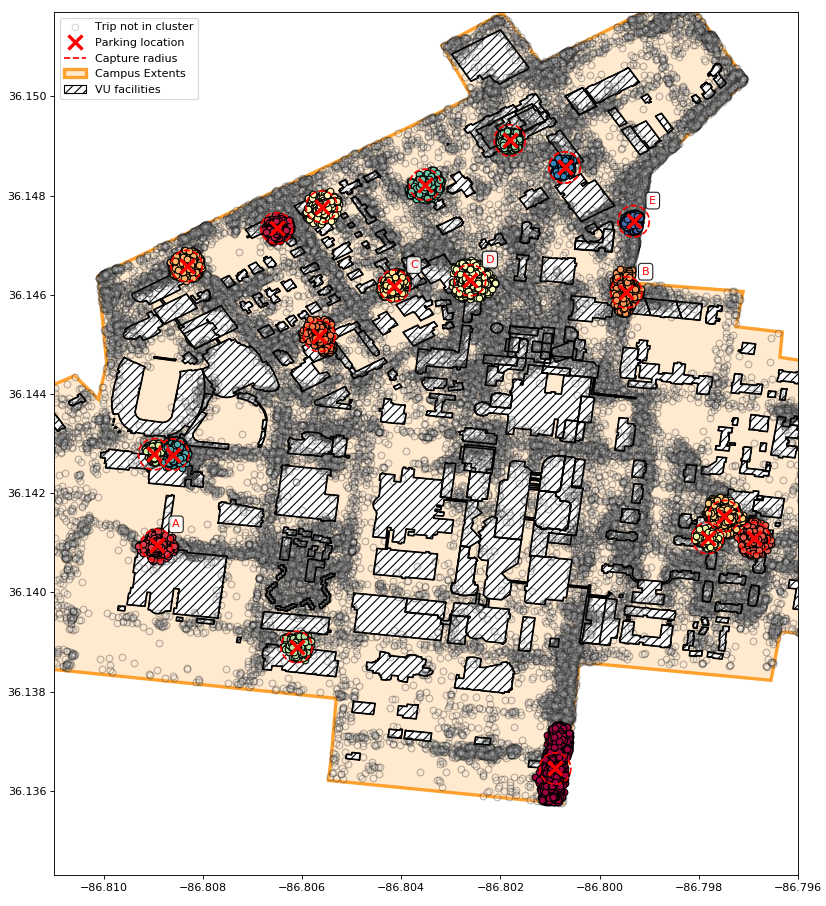
Proliferation of shared urban mobility devices (SUMDs), particularly dockless e-scooters, has created opportunities for users desiring efficient, short trips. Simultaneously, these devices have raised management challenges for cities and regulators in terms of safety, infrastructure, and parking. There is a need in some high-demand areas for dedicated parking locations for dockless e-scooters and other devices.
We use the data generated by SUMD trips for establishing locations of parking facilities and assessing their required capacity and anticipated utilization. The problem objective is: find locations for a given number of parking facilities that maximize the number of trips that could reasonably be ended and parked at these facilities. Posed another way, what is the minimum number and best locations of parking facilities needed to cover a desired portion of trips at these facilities?
We find areas of high-density trip destination points using unsupervised machine learning algorithms to serve as parking locations. The dwell time of each device is used to estimate the number of devices parked in a location over time and the necessary capacity of the parking facility. We test these methods on scooter data totalling approximately 100,000 trips at Vanderbilt University. DBSCAN is the most effective algorithm tested for determining high-performing parking locations. A selection of 19 parking locations, is enough to capture roughly 25% of all trips in the dataset. The vast majority of parking facilities found require a mean capacity of 6 scooters when sized for the 98th percentile observed demand.
Tools:
- Python 3
- scikit-learn machine learning library
Estimating arrival times on freight railroads using machine learning
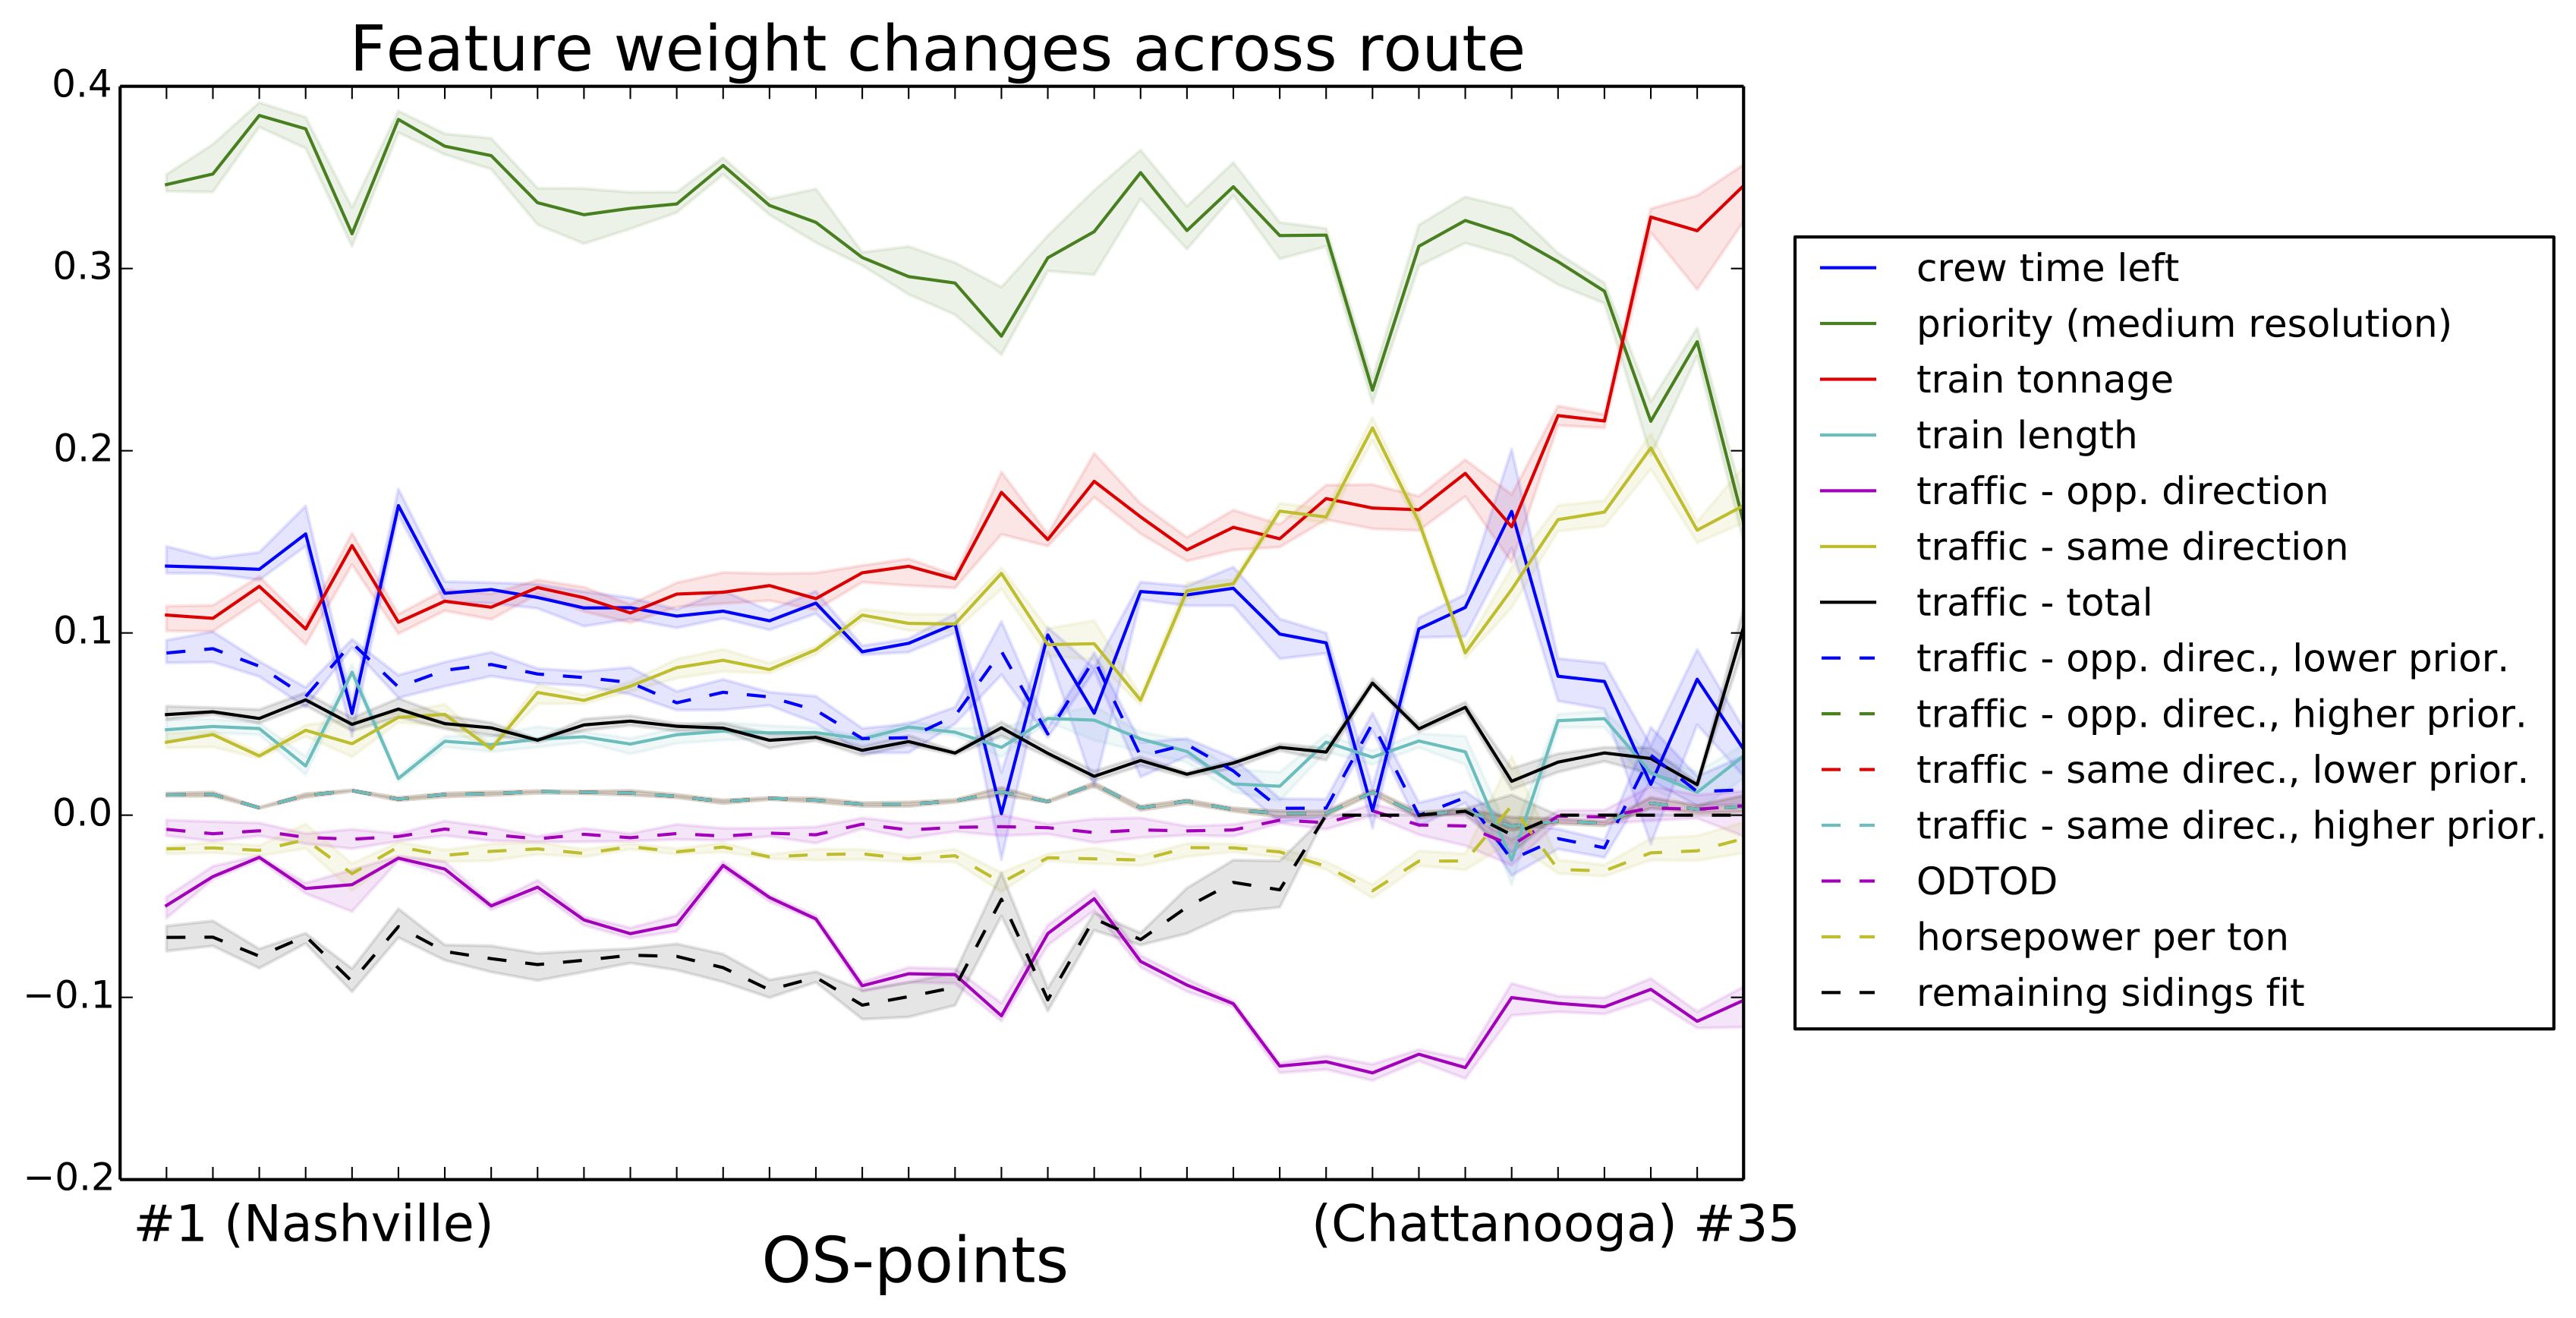
Numerous methods exist by which to estimate the arrival times (ETAs) of freight trains. Many have been applied to passenger rail, particularly in Europe. But few have investigated the predictability of freight railroads in the United States with large amounts of historical data. Using a dataset from CSX Transportation, I applied machine learning regression techniques on a rich feature set. The features mined from historical railroad operational data included train characteristics, crew information, and network state information.
The dynamics of train operations across route segments is very complex and varied due to numerous factors including topography, locations of passing sidings, and locations of intermediate yards. For this reason, independent regression models were built for a series of discrete points across each route segment. The intuition behind this modeling decision is that the factors contributing to ETA prediction change as the train completes its route. This hypothesis is supported if significant changes are observed in regression feature weights between independent models.
The methodology was tested on sections of the railroad with notoriously varied and unpredictable behavior. ETA predictive performance was compared to that of simple statisitcal methods, which are used in some prediction systems on the railroad. Results showed a consistent 20-30% improvement in prediction accuracy (mean average error) at the beginning of route segments.
Feature weights did indeed change significantly between various regression models on the same route segment. In fact, difficult topographical areas were even identifiable by increased feature weight observed for train tonnage and length.
Preprint of the journal article.
Tools:
- Python 2
- scikit-learn machine learning library
- pandas data analysis library
- PostgreSQL database with PostGIS spatial extension
- QGIS geographic information system application
Electric motor failure classification
Predictive maintenance of machinery has recently become a higher-performance methodology compared to traditional condition-based maintenance. This is due to improved sensing capabilities through the internet of things (IoT) and renewed interest in machine learning methods that perform diagnosis well. Fault states as well as machine health values can be predicted in some cases.
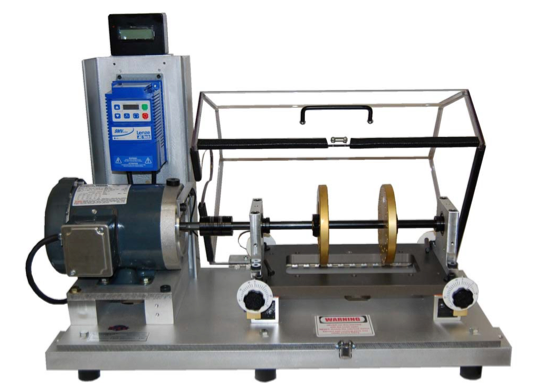
We are interested in classifying electric motor failure conditions using accelerometer data, with specific application for traction motors on railroad locomotives. Machine learning classifiers were first trained and tested on motor data from a test bench to make the binary prediction of faulty or healthy condition. Ensemble models were then developed to make the multi-label classification of which fault, or which combination of fault, are present in a motor.
Tools:
- Python 3
- scikit-learn machine learning library
- SciPy scientific computing library
- MATLAB
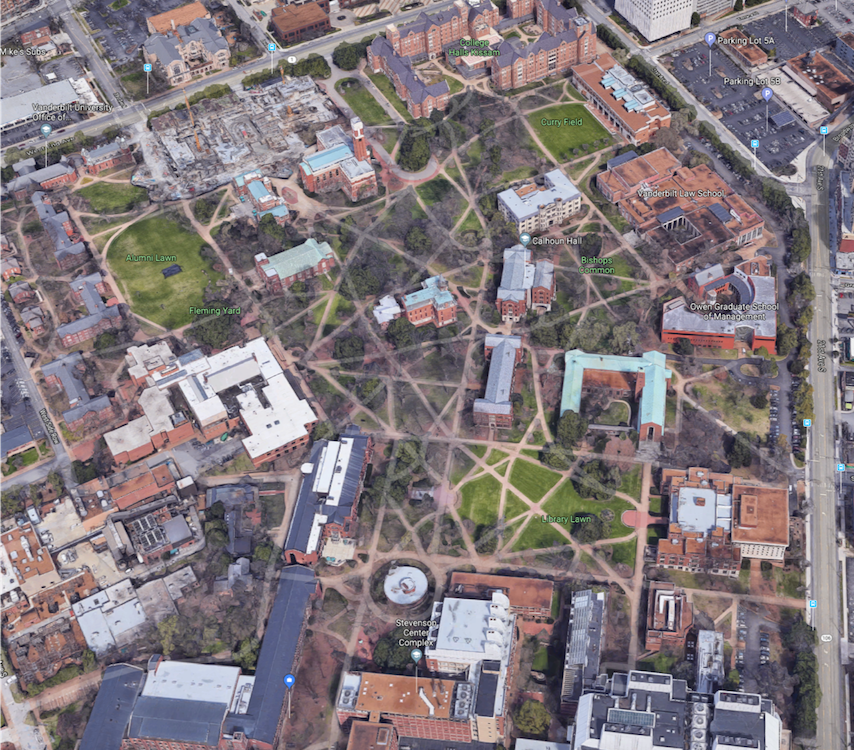
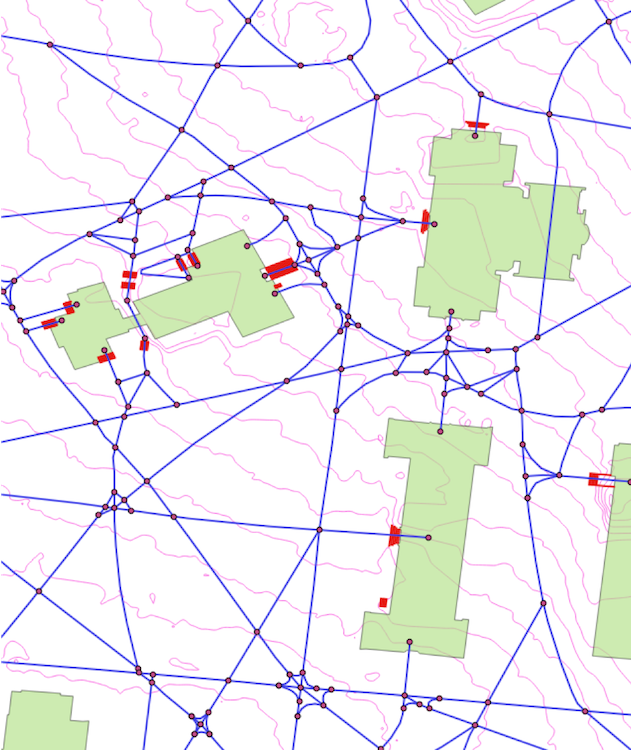
Campus mobility mapping and routing
Commercial mapping platforms are excellent at giving directions on public roadways and even for pedestrians and cyclists with consideration for accessibility by these travel modes. However, they are not very capable for pedestrian-focused areas with non-rectilinearity such as a college campus. Nor is good information typically available on these platforms for building names and points of interest.
For these reasons, Vanderbilt University is intersted in developing a campus mobility platform with enhanced functionality for students, staff, faculty, and visitors. Many of the advanced routing techniques used by large-scale mapping systems such as caching, precomputation, and optimized algorithms are not necessary. But campus-specific features such as bike rack locations, building name matching, points of interest, accessible paths, and turn-by-turn directions on unnamed irregular pedestrian ways are more important.
We developed a mapping backend, run on a remote server, and a prototype frontend iPhone application for the campus mobility platform that may eventually be integrated as a campus-supported mobile application. The backend uses an infrastructure graph assembled from raw campus GIS data, on which routing algorithms are applied for wayfinding. The prototype application incorporates basic traditional and augmented reality route guidance (seen below).


Tools:
- Python 3
- Flask + SocketIO
- Swift, ARKit
- Shapely Python spatial processing
- PostgreSQL database with PostGIS spatial extension
- QGIS geographic information system application